Method
Checking the projections
Where the revenue numbers come from, and three attempts to prove them wrong: nine years of aerial surveys of the island's real charging bays, the published industry aggregates, and the arithmetic of the island's own electric cars.
- Sites we could check
- 3/9
- the rest could not be seen or were not yet open
- Model vs measured
- ±75%
- average size of the miss at a fast-charging site
- Spread it reproduces
- 16%
- of the real gap between a busy and a quiet site
- Drivers with a source
- 1/7
- the other six are invented numbers
How much to trust a projection
Read this first
The three checks behind this verdict follow it, in order.
Treat a projection for a site with no history as an order-of-magnitude figure, not a forecast
Two of the island's four fast-charging sites could be measured from the air; one opened after the last flight and one could not be found on the ground. At the site that was measured busy, the model sits 41% under what the pictures allow. At the quiet one it sits about twice as high as the pictures allow. With 52 bay-sightings in total, neither result rejects the model on its own — the intervals are far too wide for that, and the page shows them.
The search was widened in September 2026 from the state's flights to every free archive that reaches this island — a worldwide satellite archive going back to 2011 and the national summer flights going back to 2012, together about forty dated pictures of any lot here. It added 0 bay-observations. Both wider archives are three to six times coarser than the state's three-inch flights, so a charging bay cannot be called occupied or empty on them; and neither has photographed this island since June 2025, so the station that opened in July 2026 still has no picture of it in service. That is worth stating plainly: the sample is small because the evidence does not exist, not because it was not looked for.
What the small sample does point at is the spread. The busy site's bays were occupied 4.5 times as often as the quiet one's; the model puts the two 27% apart, and it ranks the quiet one's location as the better of the two. On the raw counts that difference is suggestive rather than proven (p = 0.08, so a one-in-thirteen chance of seeing it if the two sites were equally busy). A model that cannot separate a busy site from a quiet one cannot rank sites, which is the job it exists to do.
Six of the model's seven drivers have no published number behind them. The seventh has one, and the model is calibrated roughly ten times weaker than its own source suggests.
26 of 29 stations are labelled high confidence on the strength of signals that are identical for every site in the state.
- ▸Say what a fast-charging port in Rhode Island earns on average, because the estimate starts from a published state figure and the island roll-up lands within 10% of it.
- ▸Count what is actually there — ports, stations, traffic on the frontage road, places to eat within half a mile, plug-in cars by postcode. Those are measurements and they are sound.
- ▸Show how busy three real charging sites on this island were on the days the state was photographed, which is evidence nobody else on the island has.
- ▸Rank two sites when they differ by a lot on the things that are measured, such as a site with no fast charging within three miles against one with six ports inside a mile.
- ▸Forecast one site's throughput. The band the model publishes at high confidence, plus or minus about half, is too narrow — the one falsifiable prediction tested here needed a wider one.
- ▸Separate two sites that look similar on paper. The measured spread between two real sites was four and a half fold; the model's was one and a quarter fold, in the wrong direction.
- ▸Say anything about a brand-new site with no history beyond what the state average and the site's road traffic imply. There is no site-specific evidence in the estimate at all unless the lot has been surveyed from the air.
- ▸Defend the projection for the island as a whole without assuming that most of the energy is bought by people who do not live here. That assumption may well be right on this island, and the model does not contain it.
Check 1 — the island's own charging sites, photographed
Measured off the aerial surveys
Every free archive that reaches this island, 2003 to 2026. Only the statewide three-inch surveys are sharp enough to show whether a car is standing in a charging bay; the rest are here so it is clear they were tried.
For every station below, the charging bays were found in the newest survey and the same patch of ground read on every earlier one. The measurement is how often a bay held a car. That is a ceiling on how busy the port was, never a floor: a car can sit in a bay finished, or not charging at all. So the only result that can prove the model wrong is the model claiming more than the pictures allow.
- Model within the ceiling
- Model above the ceiling
- What the surveys allow
- Band the model publishes
- Agreement
Each point is one station. The horizontal bar is what the pictures allow, the vertical bar is the band the model publishes, and the diagonal is agreement. The tinted wedge above the diagonal is the falsifying region. Both axes are multiplicative, because these numbers differ by multiples.
| Station | Bays seen | Occupied | Ceiling | Model | Miss |
|---|---|---|---|---|---|
| Tesla SuperchargerPortsmouth · fast | 40 | 38%19%–61% | 342 | 200 | −41% |
| Shell RechargeNewport · fast | 12 | 8%1%–37% | 76 | 158 | +108% |
| Clement's MarketPortsmouth · Level 2 | 20 | 35%16%–61% | 38 | 12 | −68% |
Ceiling and model are both kWh per port per day. “Occupied” is the share of bay-sightings holding a car, with the interval underneath. A positive miss means the model claims more than the pictures allow.
The signed average is near zero only because the two misses point in opposite directions, which is worse than a consistent bias: a model that is always 30% high can be corrected, one that is 40% low here and 110% high there cannot. Observed busiest ÷ quietest is 4.5×; the model's is 1.27×. The model reproduces 16% of the gap, and puts the two sites in the wrong order.
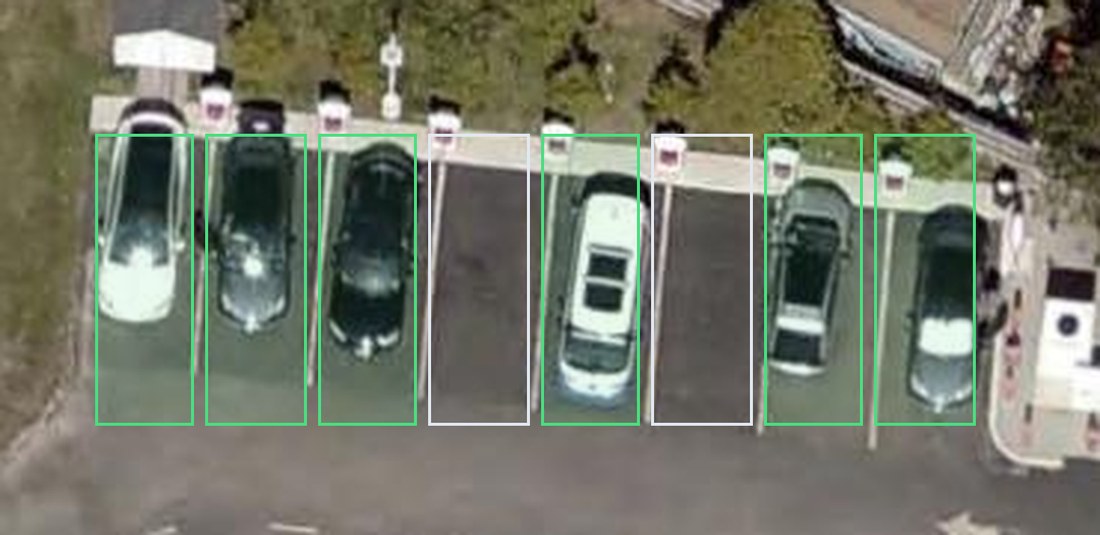
Tesla Supercharger
consistent3302 East Main Rd, Portsmouth · 8 bays · open since 2023-10
- Occupied (5 surveys × 8 bays)
- 15/40 · 38%
- Frames looked at
- 5 readable of 6the rest were too coarse to call a bay
- 95% interval, clustered
- 19% – 61%
- Ceiling, kWh/port/day
- 342
- Model says
- 200 (136–294)
- Miss
- −41%
Eight posts stand on the curb at the head of eight striped bays, all eight visible in every state flight. A bay is occupied when a vehicle body covers it. The row is signed for charging only, so a vehicle standing in it is almost always plugged in — but a finished car left on the plug counts here and would not count as utilisation.
A vehicle in the bay may be finished charging and still parked. Read the figure as a ceiling.
| Survey | Occupied | Reading |
|---|---|---|
| 2024-03 | 1 / 8 | clear |
| 2024-12 | 3 / 8 | low winter sun; the near half of the lot is in shadow but every bay is still legible |
| 2025-04 | 1 / 8 | clear |
| 2025-11 | 4 / 8 | low sun again; bays legible |
| 2026-03 | 6 / 8 | clear |
| 2025-06-03satellite · 0.50 m | not readable | Looked at and not readable. Half a metre to the pixel and smeared by the mosaic: the bay row is visible as a band, one light-coloured vehicle can be made out, and no individual bay can be called occupied OR empty. Counted as an attempt, not as a reading. |
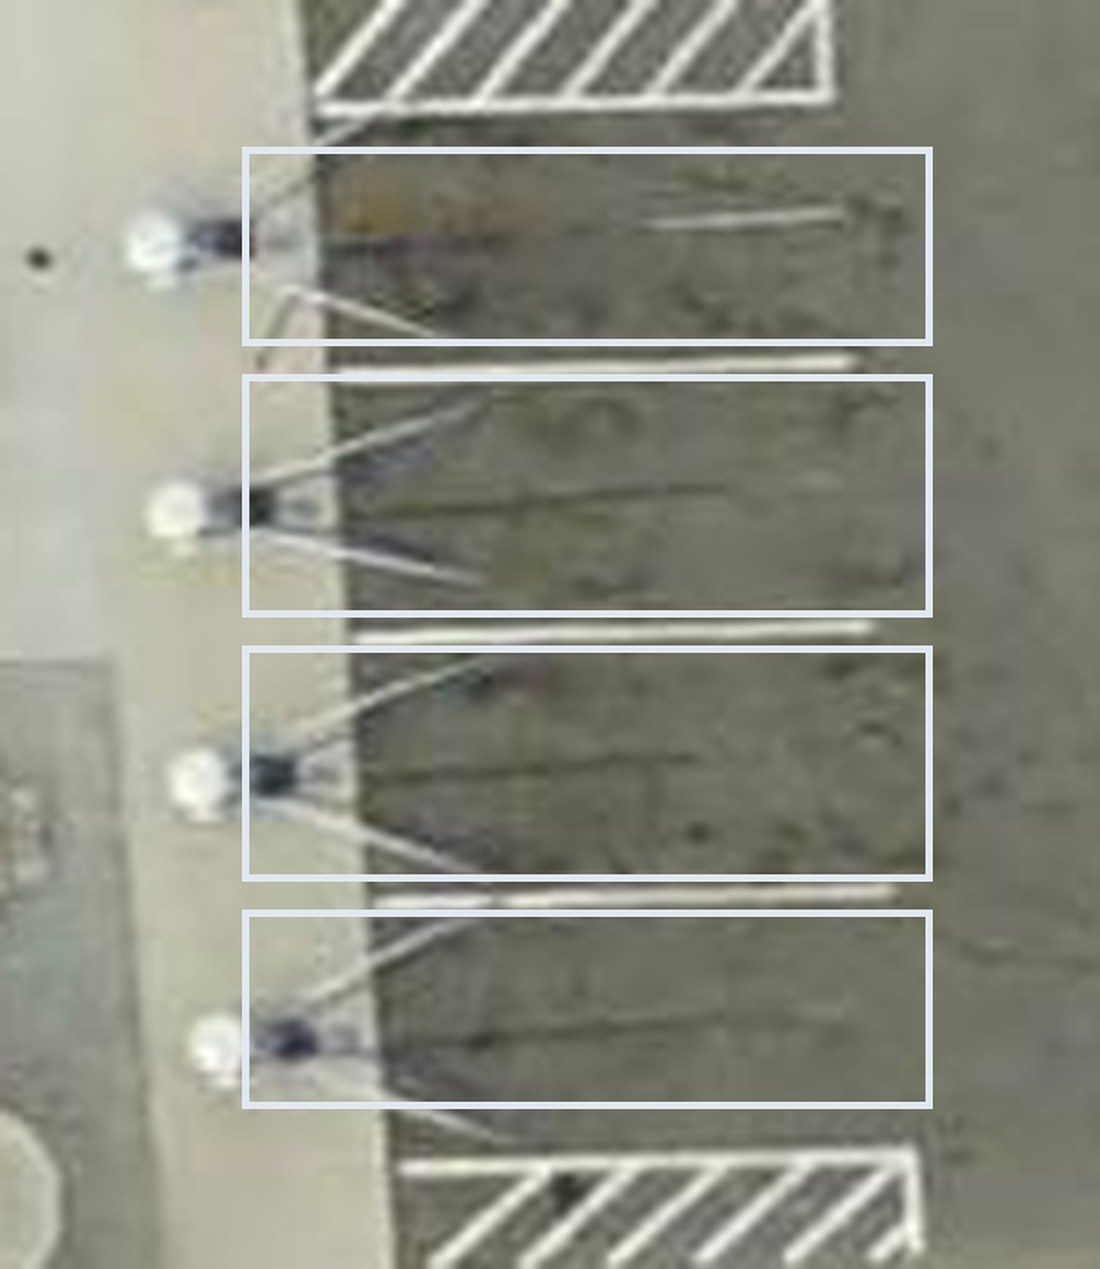
Shell Recharge
consistent138 Connell Hwy, Newport · 4 bays · open since 2024-12
- Occupied (3 surveys × 4 bays)
- 1/12 · 8%
- Frames looked at
- 4 readable of 5the rest were too coarse to call a bay
- 95% interval, clustered
- 1% – 37%
- Ceiling, kWh/port/day
- 76
- Model says
- 158 (108–232)
- Miss
- +108%
Four angled bays at the south end of the charging island, each with its own dispenser and a cable curled on the pavement. The bays further north carry the accessible-parking symbol and belong to the shop, not to the chargers: in Mar 2024 they hold four cars while all four charging bays are empty, which is what separates them.
Same ceiling as above.
| Survey | Occupied | Reading |
|---|---|---|
| 2024-12 | 1 / 4 | the station opened this month; excluded from the totals as the opening month |
| 2025-04 | 1 / 4 | clear |
| 2025-11 | 0 / 4 | the bays sit in building shadow; brightened to read them, all four legible |
| 2026-03 | 0 / 4 | clear |
| 2025-06-03satellite · 0.50 m | not readable | Looked at and not readable. Half a metre to the pixel and smeared by the mosaic: the bay row is visible as a band, one light-coloured vehicle can be made out, and no individual bay can be called occupied OR empty. Counted as an attempt, not as a reading. The four angled bays smear into a single band at this ground pixel. |
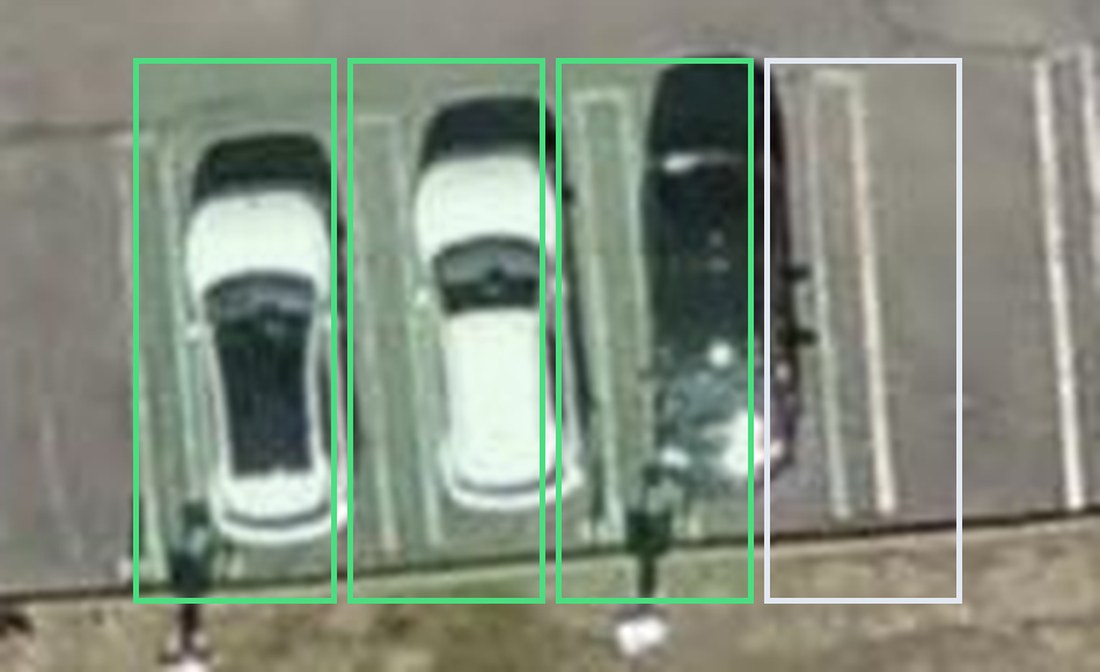
Clement's Market
bound only2575 East Main Rd, Portsmouth · 4 bays · open since 2023-08
- Occupied (5 surveys × 4 bays)
- 7/20 · 35%
- Frames looked at
- 6 readable of 7the rest were too coarse to call a bay
- 95% interval, clustered
- 16% – 61%
- Physical ceiling, kWh/port/day
- 38
- Model says
- 12 (8–18)
- Miss
- −68%
Four bays painted green, with two pedestals on the island behind them, one pedestal per pair. The green paint is absent in Mar 2023 and present from Mar 2024, which dates the install and confirms the bays.
This is a grocery lot. A car in a green bay may be charging, may be an electric car parked without plugging in, or may be a petrol car in an electric bay. The occupancy figure bounds Level 2 use from above and the bound is loose.
| Survey | Occupied | Reading |
|---|---|---|
| 2024-03 | 2 / 4 | clear |
| 2024-12 | 1 / 4 | clear |
| 2025-04 | 0 / 4 | clear |
| 2025-11 | 1 / 4 | clear |
| 2026-03 | 3 / 4 | clear |
| 2023-08-22national · 0.30 m | 0 / 4 | A national summer flight three days before the registry's opening date. All four bays empty and the two pedestals already standing, which dates the installation to within three days instead of the eleven-month window the state flights gave. Excluded from the totals as the opening instant, exactly as the opening month is excluded elsewhere. |
| 2025-06-03satellite · 0.50 m | not readable | Looked at and not readable. Half a metre to the pixel and smeared by the mosaic: the bay row is visible as a band, one light-coloured vehicle can be made out, and no individual bay can be called occupied OR empty. Counted as an attempt, not as a reading. At this ground pixel the green bay paint does not resolve either, so the bays cannot even be located. |
- Hours of the day the surveys sample
- 7 h, around midday
- Share of a day's charging in that window
- 45%
- Length of a fast-charging session
- 30.7 min
- Energy in one session
- 30 kWh
The last two are the model's own constants, so the comparison cannot be tilted by picking different ones. The second is the weak link and has no source: it says the seven middle hours of the day carry 45% of a day's charging, against 29% if charging were spread evenly. Everything below is that assumption moved.
| If instead… | Tesla | Shell |
|---|---|---|
| Charging is flatter than assumed | 440 | 98 |
| Charging is more peaked at midday | 280 | 62 |
| Shorter sessions (25 min) | 420 | 93 |
| Longer sessions (45 min) | 233 | 52 |
| Less energy per session (22 kWh) | 251 | 56 |
| More energy per session (33 kWh) | 376 | 84 |
| As shown above | 342 | 76 |
The ceiling moves by roughly a third in either direction on these assumptions. The occupancy figures above it do not move at all — they are counted, not derived, which is why they are the headline and the kWh is not.
The bays were read by eye off the survey crops rather than by the vehicle detector already built for the parking work. The detector is good at finding cars in an open lot and poor at the two things this job needs: telling which bay a car is in when the row is tight, and seeing a pale car against bright concrete. Run over the same three crops it finds fewer cars than the eye does every time, so using it would have pushed the occupancy — and with it the ceiling — too low.
| Survey | Read by eye | Detector | Missed |
|---|---|---|---|
| 2024-03 | 1 | 1 | 0 |
| 2025-11 | 4 | 2 | 2 |
| 2026-03 | 6 | 4 | 2 |
Vehicles-only pass, no mask refinement, on the same pixel window. Read as a floor on the count, not a count.
Three more archives, forty-odd dated pictures of every lot, and not one new bay-observation. The wider archives are coarser than the state's flights and none of them has photographed this island since June 2025, so the two fast-charging stations that could be measured are still the only two, and the spread result is unchanged.
| Kind of picture | Dates here | Best pixel | Newest | Shows a bay? | Readings added |
|---|---|---|---|---|---|
| State imageryThis state only. Nineteen leaf-off flights at three inches since Apr 2018, plus five coarser statewide and coastal rasters back to Apr 2003. | 24 | 0.08 m | 2026-03 | yes | 72 |
| Satellite imageryWorldwide, every release of the global basemap kept since 2014. Eight to ten distinct photographs of any lot here, back to Apr 2011. | 9 | 0.30 m | 2025-06-03 | no | 0 |
| National imageryWhole country, one summer flight every two or three years since 2012. Six dates here: 1 m in 2012 and 2014, 0.6 m in 2016, 2018 and 2021, 0.3 m in 2023. | 6 | 0.30 m | 2023-08-22 | yes | 0 |
| Land-observation satellitesFree, global, every few days. Ten metres to the pixel on the better one, thirty on the other. | – | 10 m | continuous | no | 0 |
- State imagery. The whole measurement. A charger post, its cable on the pavement and the stripe either side of a bay are separate objects at three inches. Every post-opening flight at every station has been read; there are no unread ones left.
- Satellite imagery. Added nothing. One capture falls after any station opened (3 Jun 2025) and at half a metre, smeared by the mosaic, not one bay at any of the three stations could be called occupied or empty. A white car is visible; a dark car on dark asphalt is not, which would have biased occupancy DOWN — the wrong direction for a ceiling. The three frames are in the tables below as attempts with nothing read.
- National imagery. Sharp enough at 0.3 m — the 2023 frame reads four empty bays and two pedestals at the grocery site cleanly — but every date it holds predates the opening of all three measurable stations by at least three days. It is the archive most likely to widen this backtest next: the next national flight will be 0.3 m and nationwide, so it works on any site the owner looks at, not only ones in this state.
- Land-observation satellites. Checked and rejected on arithmetic, not on trial. A car is 4.5 m long: under half a pixel at ten metres, a fifth of a pixel at thirty. A whole charging island is one pixel. These are land-cover instruments and nothing about a parking bay can come out of them — worth stating so nobody re-proposes them.
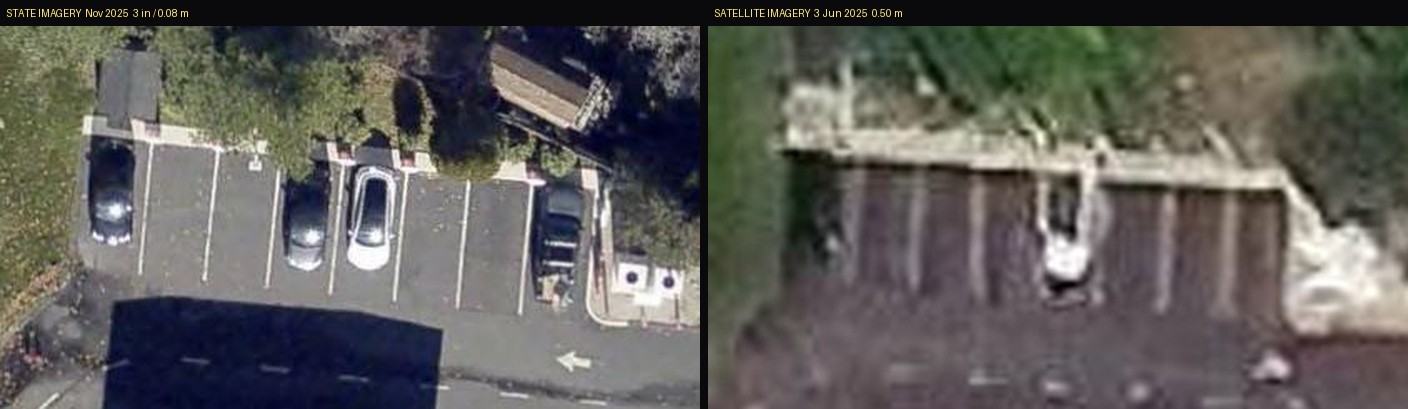
15 of the 18 frames pulled across the three measurable stations produced a reading. The ones that did not are listed above station by station with the reason, because a frame that was looked at and could not be read is evidence about the method, not a gap in the search.
RI OER Newport · 27 Connell Highway, Newport · 6 fast ports
Opened July 2026 and still not photographed in service by anything free. The March 2026 state flight catches the site mid-build — the pad excavated, conduit runs laid out beside it, a contractor's trailer and a tracked excavator on the ground, and a new bay row being striped at the south end — which confirms the position and dates the construction, and is the nearest thing to evidence that exists. The wider archives are no help: the newest satellite photograph of this corner is 3 June 2025 and the newest national flight 22 August 2023, both from before the ground was broken. The first state flight after July 2026 is the first chance anyone gets.
NewportChargers · 1215 West Main Rd, Middletown · 2 fast ports
The two listed positions for this station are 60 m apart and neither lands on anything that looks like a charger. The lot is a dealership forecourt packed bumper to bumper with inventory in every frame, so parked vehicles carry no charging signal even if the bays were found. Re-attempted against the satellite and national archives and it got worse, not better: both are coarser than the three-inch flight that already failed to find the hardware, so nothing there can locate a bay the sharp picture could not.
Middletown Town Hall · 350 East Main Rd, Middletown · 4 Level 2 ports
Two pedestals are visible at the kerb, but the bays beside them carry no paint that separates them from ordinary staff parking, so an occupied bay proves nothing. Nothing in the wider archives changes that: the obstacle is paint on the ground, not resolution.
Atlantic Beach Hotel · 28 Aquidneck Ave, Middletown · 6 Level 2 ports
No charging hardware could be identified near the listed position in any flight.
Wayfinder Hotel · 151 Admiral Kalbfus Rd, Newport · 6 Level 2 ports
Same: the pedestals are at or below what 3-inch pixels resolve, and the bays are unmarked.
Middletown Library · 700 West Main Rd, Middletown · 4 Level 2 ports
Added to the attempt when the archives were widened in Sep 2026, and it fails the same way as the other Level 2 sites: no charging hardware and no bay paint can be identified at the registry position on the newest three-inch flight, and the coarser archives cannot see what the sharp one cannot. Open since Oct 2019, so if the bays could be found it would be the longest run of post-opening frames on the island — which is exactly why it was tried.
This list is part of the result. The method only works where a charging bay can be told apart from ordinary parking, and on this island that was true at three sites out of 9. Widening the search from the state's surveys to every free archive did not rescue a single one of them: the obstacle at the Level 2 sites is paint on the ground rather than resolution, and at the one fast-charging site that is simply too new, no archive anywhere has photographed it in service.
Check 2 — does the island total make sense against everything else we know?
The roll-up against everything published
The island roll-up against the published state and national figures, and against what the island's own electric cars could possibly buy.
The island is modelled 7% busier per fast port than the state average
179 kWh per port per day works out to 12.7% of the day in use, against a published 11.9% for the state. The island is a tourist destination, so some premium is expected; this is the size of it.
The island holds 13% of the state's fast ports and 7% of its plug-in cars
20 of the state's 152 fast ports serve 1,178 of its 16,662 plug-in cars. Ports per local car here are 1.9× the state's. On that alone a port here should be quieter than the state average, not busier — the projection only holds if drivers from off the island fill the gap.
The projection is 2.4× everything the island's own electric cars buy in public in a year
1,178 plug-in cars on the island need about 3.06 GWh a year in total, of which perhaps 20% — 0.61 GWh — is bought in public. The projection for the island's public chargers is 1.50 GWh. The difference has to come from drivers who do not live here: 59% of the energy. Nothing in the model represents visitors, so that share is an accident of the arithmetic rather than something the model claims.
Read the first line with care. The estimate starts from the published state figure and multiplies it by the drivers, so a roll-up near the state average is close to arithmetic, not confirmation. The only thing this check can catch is the drivers pushing the whole island systematically off the anchor — which is what the number above measures, and nothing more.
- Modelled, per fast port per day
- 179 kWh
- Implied share of the day in use
- 12.7%
- Published, this state
- 11.9%
- Published, nationally
- 15.8%
- Modelled sessions per port per day
- 6.0
- Published, this state
- 5.7
- Share of the state's fast ports
- 13%
- Share of the state's plug-in cars
- 7%
- Share of the state's people
- 5%
- Share of the state's fast-charging energy, as modelled
- 14%
Twice as many fast ports per local electric car as the state average, and the model still has each port busier than the state average. Both can only be true if drivers from off the island make up the difference.
- Total energy those cars need each year
- 3.06 GWh
- Assumed bought in public
- 20%
- Projection ÷ resident demand
- 2.4×
- Energy that must come from visitors
- 59%
- Public charging per resident plug-in car, implied
- 1,271 kWh/yr
That last figure is about half of everything a car on this island would use in a year, bought in public — implausible in a place of driveways and garages. The projection therefore rests on visitors, which is plausible for Newport in August and is nowhere in the model. Move the assumptions and the ratio moves with them; the direction does not.
Check 3 — which lever actually decides the answer
One driver at a time
Each driver swung across the range seen on this island, one at a time, with the rest held still.
- Number has a source
- Partly sourced
- Invented number
- Base case
A hatched bar means the number behind that driver is invented. Each bar swings one driver across the range seen on this island and leaves the others where they are. The drivers multiply, so the bars do not add up to the spread between two real sites — they say which lever moves the answer, not how the answer was built.
Competing fast chargers
×0.54–1.15guess1 ÷ (1 + 0.08 × ports within 1 mi + 0.02 × further ports within 3 mi), with a ×1.15 bonus for a gap on a busy road
0.08 per competing port within a mile, 0.02 further out, and a 15% bonus for a gap. None of the three has a source. The shape is at least the right sign, and it is the driver that moves the answer most.
Frontage traffic
×0.74–1.31guess(vehicles per day ÷ 15,000) to the power ½, held between 0.55 and 1.60
The exponent of ½ has no source behind it. It says doubling the traffic on the road lifts charging by 41%, which is a plausible-sounding shape and nothing more. No study in the published set relates a charging site's throughput to its road's traffic count.
Parking demand seen from the air
×0.85–1.25guess0.85 + 0.60 × the share of survey flights with a car in the stall, held between 0.85 and 1.25
Never applies to anyone else's station — there is no aerial stall survey of a competitor's lot — so it contributes nothing to the numbers on this page. It does apply to the owner's own sites, where it is the only genuinely site-specific signal in the whole estimate, and its coefficient is invented.
Things to do nearby
×0.80–1.20partly cited0.80 + 0.40 × min(1, weighted places within half a mile ÷ 40)
There is a published figure behind this one and the model contradicts it. The cited retail study puts the median at 42 sessions a day for fast-charging stations at a grocery store against 3 for stations with no amenity at all — a 14-fold difference at station level. The model allows 1.5-fold, top to bottom, and saturates at 40 weighted points, which most island stations clear. It is the only driver with evidence and it is calibrated an order of magnitude too weak.
Local EV adoption
×1.11–1.27guess(local plug-in share ÷ state share) to the power ½ for fast charging, ⁷⁄₁₀ for Level 2
The square root is there because through-traffic dilutes the local fleet. That reasoning is sound and the number is invented. The registration counts underneath it are real and public; the exponent applied to them is not.
Visibility & access
×0.92–1.06guess0.92 with no frontage stalls, 1.02 with one entrance, 1.06 with two
Three hand-set numbers within 14% of each other. Too small to change any decision and too invented to defend.
Charger power
×0.94–1.00guess0.94 + 0.06 × min(1, unit kW ÷ 250)
A 6% nudge for charger power. The real effect runs through energy per session, not sessions per day, and the model holds energy per session fixed at 30 kWh — so this driver is pointing at the wrong quantity as well as being unsourced.
- High confidence
- 26
- Medium
- 3
- Low
- 0
26 of the 29 stations on the island come back "high confidence". The test is simply "three or more signals present", and two of the four signals are the same number for every site in the state. Any site with a traffic count on its frontage road therefore scores high automatically, whether or not anything site-specific is known about it.
State-level charging benchmark
The same value for every site in Rhode Island. It sets the level of the estimate; it cannot separate two sites in the same town.
Local plug-in registration share
Published by postcode. The island's three postcodes differ by less than a percentage point, so on this island it is close to a constant too.
Count the state benchmark and the postcode registration share as one regional signal between them, and require the aerial parking survey — the only input that is genuinely about this lot and no other — before an estimate is allowed to call itself high confidence. On this island that would move almost every station from high to medium, which widens the published band from ±47% to ±62% and is a fairer statement of what is known.
What would have to change
Proposed, not applied
Nothing here has been changed yet. Two stations is not a basis for refitting a coefficient, and the file these live in is open elsewhere.
Stop two statewide constants from buying a high-confidence label
- Change
- In the confidence count, treat the state benchmark and the postcode registration share as one regional signal, and require the aerial parking survey for "high".
Both are the same number for every site in the state, so they cannot distinguish one site from another, yet either one alone can carry an estimate from medium to high. This is the change with the clearest case: it is a bug in how evidence is counted, not a guess about driver strength.
Effect Almost every island station drops from high to medium. The published band on a fast-charging estimate widens from ±47% to ±62% — which is what the one testable prediction on this page turned out to need.
Let the amenity driver move as far as its own source says
- Change
- Replace 0.80 + 0.40 × min(1, weighted ÷ 40) with 0.65 + 0.70 × min(1, weighted ÷ 60).
The retail study already cited by the model puts grocery-co-located fast charging at 42 sessions a day against 3 where there is nothing to do — fourteen-fold. Station-level medians confound site size and location, so the whole gap should not be taken at face value, but 1.5-fold top to bottom is an order of magnitude too flat, and the current curve saturates below where most real sites sit.
Effect Widens the driver's range from 1.5× to 2.1× and un-saturates it. Does not change the island average, only the spread between sites — which is the thing the backtest found too compressed.
Represent the charging network, which is currently missing entirely
- Change
- Add a multiplier for the brand on the charger, and a separate one for sitting on a route on and off the island rather than a local street.
The two fast-charging sites that could be measured differ four and a half fold in how busy they are. The model has them 27% apart, and it gets the sign wrong: it gives the quieter site more traffic and far more amenities. What separates them is not in the model — one is a manufacturer's own network on the main road on and off the island, the other is an open network on a local street a mile from the bridge.
Effect Cannot be calibrated from two stations. Named here because it is the largest thing the model does not know, not because a number is ready.
The full method, every assumption, the survey-by-survey table and the exact edits are written up in the finance notes beside this tool so the work can be checked without re-running it.